Effect of Flow Rates on Erosion of Inner Walls of Bends
Posted: 08/28/2024 05:10:50 Hits: 25
On this page
Based on the self-designed organic glass bend test section, this paper presents an erosion experiment of liquid-solid two-phase flow on a bend using the existing circulation pipeline to study the effect of flow rate on the erosion of the inner wall of the bend.
The experimental material is X70 pipeline steel, and its chemical composition and mechanical properties are shown in Table 3-1.
Table 3-1 Chemical composition of X70 pipeline steel (wt%)
Table 3-1 Chemical composition of X70 pipeline steel (wt%)
| Elements | C | Si | Mn | P | S | V | Nb | Ti |
| Content (wt%) | ≤0.16 | ≤0.45 | ≤1.70 | ≤0.02 | ≤0.01 | ≤0.06 | ≤0.05 | ≤0.06 |
Table 3-2 Mechanical properties of X70 pipeline steel
| Material | Tensile strength (MPa) | Yield strength (MPa) | Yield strength ratio | Elongation (%) |
| X70 | 485-605 | ≤0.90 | 18 | ≥40 |
Cut the X70 steel into cylinders with a diameter of 6 mm and a height of 10 mm. Clean and dry the cut samples, then grind and polish the circular surface installed in the tube. Clean again; dry with hot air, and then weigh and record the weight of each sample before erosion.
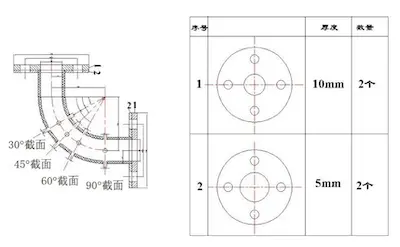
Figure 3-1 shows the design and processing drawing of the experimental bend. Numbers 1 and 2 in the figure represent the fixed flanges at both ends, which are used to connect and secure the bend to the pipeline nozzle. Three through holes with a diameter of 6 mm and a depth of 5 mm are drilled on the inner arch side wall, side wall, and outer arch side wall of the four sections (30°, 45°, 60°, 90°) of the bend for installing samples.

Figure 3-1 Design and processing drawings of bends
Figure 3-2 shows the finished organic glass experimental bend. The upstream flange of the bend is connected and secured to the nozzle flange, while the downstream flange is connected to the external hose to discharge the liquid-solid two-phase flow into the mixing tank. The round rod wrapped with anti-seepage tape, shown in the figure, is the sample, which is installed on the inner arch side wall, side wall, and outer arch side wall of four sections with different angles.

Figure 3-2 Installation diagram of organic glass bends
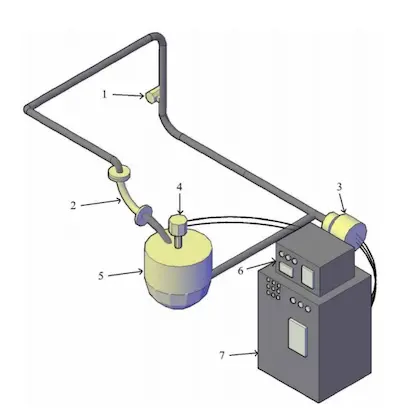
Figure 3-3 is the flow chart of the entire experiment. Pour the water and quartz sand in the correct proportion into the mixing tank. Use the frequency converter to control the speed of the centrifugal pump and adjust the flow and velocity of the pipeline. The fluid flows through the experimental bend section and returns to the mixing tank through the connected hose, completing the cycle of the entire experiment.

1. Flowmeter 2. Experimental bend 3. Centrifugal pump 4. Stirring rotor 5. Liquid storage tank 6. Stirring motor 7. Inverter
Figure 3-3 Experimental flow chart

Figure 3-1 Design and processing drawings of bends
Figure 3-2 shows the finished organic glass experimental bend. The upstream flange of the bend is connected and secured to the nozzle flange, while the downstream flange is connected to the external hose to discharge the liquid-solid two-phase flow into the mixing tank. The round rod wrapped with anti-seepage tape, shown in the figure, is the sample, which is installed on the inner arch side wall, side wall, and outer arch side wall of four sections with different angles.

Figure 3-2 Installation diagram of organic glass bends
Figure 3-3 is the flow chart of the entire experiment. Pour the water and quartz sand in the correct proportion into the mixing tank. Use the frequency converter to control the speed of the centrifugal pump and adjust the flow and velocity of the pipeline. The fluid flows through the experimental bend section and returns to the mixing tank through the connected hose, completing the cycle of the entire experiment.

1. Flowmeter 2. Experimental bend 3. Centrifugal pump 4. Stirring rotor 5. Liquid storage tank 6. Stirring motor 7. Inverter
Figure 3-3 Experimental flow chart
(1) Polish the sample. Clean it; dry it, and then weigh and record it.
(2) Install the sample on each section of the organic glass bend according to the number, then seal and fix it with anti-seepage tape and organic glass glue.
(3) Install the bend with the sample onto the circulating pipe flow test bench.
(4) Pour the water and quartz sand into the mixing tank and mix them evenly. Adjust the frequency converter to ensure the flow rate meets the test requirements.
(5) Check if the entire pipeline is stable and if there is any leakage.
(6) After completing the 6-hour experiment, remove the sample; process it, weigh it, and record the weight. Then place it in a sealed bag with desiccant.
Table 3-3 Mass change of samples in bends at different flow rates
| Items | Weight loss (g) | Weight loss rate (%) | ||||
| 1m/s | 2m/s | 3m/s | 1m/s | 2m/s | 3m/s | |
| 1 | -0.0007 | -0.0001 | 0.0001 | -0.04 | -0.01 | 0.00 |
| 2 | 0.0001 | 0.0001 | 0.0006 | 0.00 | 0.00 | 0.03 |
| 3 | 0.0000 | 0.0011 | 0.0017 | 0.00 | 0.06 | 0.09 |
| 4 | -0.0006 | -0.001 | 0.0017 | -0.03 | -0.05 | 0.09 |
| 5 | 0.0003 | 0.0007 | 0.0008 | 0.02 | 0.04 | 0.04 |
| 6 | 0.0006 | 0.0019 | 0.0024 | 0.03 | 0.10 | 0.12 |
| 7 | 0.0001 | -0.001 | -0.0012 | 0.01 | -0.05 | -0.06 |
| 8 | 0.0009 | 0.0013 | 0.0019 | 0.05 | 0.07 | 0.10 |
| 9 | 0.0015 | 0.0024 | 0.0037 | 0.08 | 0.12 | 0.19 |
| 10 | 0.0003 | -00019 | -0.0014 | 0.02 | -0.10 | -0.07 |
| 11 | 0.0011 | 0.0026 | 0.0035 | 0.06 | 0.13 | 0.18 |
| 12 | 0.0023 | 0.0030 | 0.0038 | 0.12 | 0.15 | 0.1 |
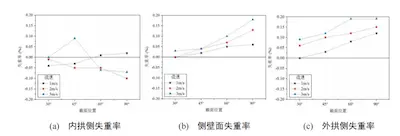
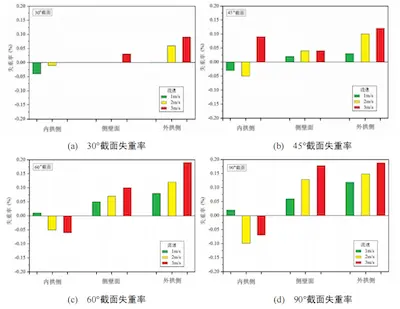
The erosion observation is conducted from different angles, such as 30°, 45°, 60°, and 90°, as shown in Figure 3-1) and different wall positions such as inner arch side, side wall surface, and outer arch side wall surface). As shown in Figure 3-2, the specimens corresponding to the 30° section are numbered 1, 2, and 3; the 45° section specimens are numbered 4, 5, and 6; the 60° section specimens are numbered 7, 8, and 9; and the 90° section specimens are numbered 10, 11, and 12. The specimens on the inner arch side are numbered 1, 4, 7, and 10; the side wall specimens are numbered 2, 4, 6, and 8; and the outer arch side specimens are numbered 3, 6, 9, and 12. Table 3-3 shows the changes in the mass of the specimens in the bend at different flow rates; Figure 3-4 shows the weight loss rate of the specimens with different cross sections in the bend at different flow rates; and Figure 3-5 shows the weight loss rate of the specimens with different wall surfaces in the bend at different flow rates.
Table 3-4 Changes in sample mass in the bend at different particle concentrations
Table 3-4 Changes in sample mass in the bend at different particle concentrations
| Items | Weight loss (g) | Weight loss rates(%) | ||||
| 5% | 10% | 15% | 5% | 10% | 15% | |
| 1 | -0.0001 | -0.0001 | -0.0002 | -0.01 | -0.01 | -0.01 |
| 2 | 0.0000 | 0.0001 | 0.0003 | 0.00 | 0.00 | 0.02 |
| 3 | 0.0007 | 0.0011 | 0.0015 | 0.04 | 0.06 | 0.08 |
| 4 | -0.0007 | -0.001 | 0.0003 | -0.04 | -0.05 | 0.02 |
| 5 | 0.0003 | 0.0007 | 0.0006 | 0.02 | 0.04 | 0.03 |
| 6 | 0.0013 | 0.0019 | 0.0021 | 0.07 | 0.10 | 0.11 |
| 7 | -0.0011 | -0.001 | 0.0013 | -0.06 | -0.05 | 0.07 |
| 8 | 0.0009 | 0.0013 | 0.0015 | 0.05 | 0.07 | 0.08 |
| 9 | 0.0016 | 0.0024 | 0.0030 | 0.08 | 0.12 | 0.18 |
| 10 | 0.0005 | -0.0019 | 0.0021 | 0.03 | -0.10 | 0.10 |
| 11 | 0.0017 | 0.0026 | 0.0029 | 0.08 | 0.13 | 0.15 |
| 12 | 0.0025 | 0.0030 | 0.0035 | 0.13 | 0.15 | 0.1 |

(a) Weight loss rate of inner arch side (b) Weight loss rate of side wall (c) Weight loss rate of outer arch side
Figure 3-4 Weight loss rate of samples with different cross sections in bends with different flow rates

(a) Weight loss rate of 30° cross section (b) Weight loss rate of 45° cross section
(c) Weight loss rate of 60° cross section (d) Weight loss rate of 90° cross section
Figure 3-5 Weight loss rate of samples with different wall surfaces in bends with different flow rates
Table 3-3 shows that the mass of most samples decreased after the test, while the mass of a few samples increased slightly. After comparing the wall surfaces and angle sections, the samples with increased mass are mainly on the inner arch side wall. Analysis shows that since the inner arch side is subjected to a lighter impact, the erosion causes minimal damage to the material matrix, and some slight scratches have little effect on the mass loss. Additionally, the polished samples produce corrosion products after being immersed in the pipe for an extended period, and the subsequent collisions cannot wash away these products, resulting in an increase in the mass of these samples. Figures 3-4 and 3-5 show that, due to the inertial force of the fluid at the bend section, the solid-phase particles follow the fluid and directly collide with the sample surface on the outer arch side wall, resulting in a higher weight loss rate of the sample on the outer arch side compared to the side wall and inner arch side. The sample on the inner arch side wall has the smallest weight loss rate and even shows an increment due to the smaller erosion intensity. The weight loss rate of the sample on the side wall is greater than that of the sample on the inner arch side but less than that of the sample on the outer arch side. As the fluid flow rate and section angle increase, the weight loss rate of the side wall sample and the outer arch side wall sample increases accordingly.
After calculation, the average weight gain of the inner arch side specimens at flow rates of 1m/s, 2m/s, and 3m/s are 0.01%, 0.03%, and 0.01%, respectively. The average weight loss of the side wall specimens at flow rates of 1m/s, 2m/s, and 3m/s are 0.0325%, 0.06%, and 0.0875%, respectively. The average weight loss of the outer arch side specimens at flow rates of 1m/s, 2m/s, and 3m/s are 0.0575%, 0.1075%, and 0.1475%, respectively.
Post URL: https://www.landeepipefitting.com/effect-of-flow-rates-on-erosion-of-inner-walls-of-bends.html
Landee is a professional industrial pipe fitting manufacturer and be well accepted by customers all over the world, we has been producing Pipe Fitting for a variety of applications since 1985. welcome to access our website: https://www.landeepipefitting.com.
Previous: Erosion in a Pipe Bend
Next: Application & Failure of Expansion Joints in High-Temperature Flue Gas Pipes
Next: Application & Failure of Expansion Joints in High-Temperature Flue Gas Pipes
