ASTM A106B pipeline steel was used for the base material, with 2.4 mm ER70S-G solid wire selected for welding. Butt welding of the steel pipes was performed using two methods: (1) a combination of Gas Tungsten Arc Welding (GTAW) and Shielded Metal Arc Welding (SMAW), (2) GTAW alone. No pre-weld or post-weld heat treatment was applied. The corrosion behavior of the welded joints was analyzed by measuring the polarization curves of the weld seam, heat-affected zone, and base material. The results show that in both joints, corrosion resistance decreases in the following order: base material > heat-affected zone > weld seam.
Introduction
Welding technology is widely used for connecting oil and gas pipelines in the petroleum and natural gas industry. However, welded pipeline joints are prone to corrosion during operation, which can lead to operational failures and safety incidents. As a result, understanding and improving the corrosion resistance of welded pipe joints is crucial.
Yi Yu et al. studied the CO₂ corrosion of X65/316L mechanical composite pipe welded joints and found that the corrosion rate increased progressively with rising temperature. Lihua Hu et al. investigated the CO₂ corrosion of 3Cr low-alloy pipeline steel and its welded joints, revealing that in a CO₂-corrosive environment, the base metal of the welded joint corroded first, while the weld seam and heat-affected zone remained relatively protected. Zongyue Bi et al. used a microelectrode scanning technique to analyze the susceptibility of HFW weld seams to groove corrosion. Their results showed that the weld region exhibited significantly high and unevenly distributed corrosion currents, making it highly prone to groove corrosion. Although existing research explores the corrosion behavior of welded joints, few studies specifically examine the electrochemical corrosion of distinct joint regions. This study first analyzes the microstructure of each joint region and then evaluates corrosion characteristics through polarization curve measurements. The findings provide valuable insights for improving the quality of on-site welding in carbon steel pipelines and ensuring the safe operation of pipeline systems.
1. Test Materials, Equipment, and Test Methods
The base material is ASTM A106B, and ER70S-G solid wire (2.4 mm in diameter) is used as the welding wire, specifically for the root pass in GTAW (Gas Tungsten Arc Welding). The chemical composition of the materials is provided in Table 1. The A106B parent material is a tubular specimen with an outer diameter of 219.1 mm and a wall thickness of 10.3 mm. The specimen has a V-shaped groove with a 60° angle and a 1.2 mm blunt edge.
Table 1: Chemical Composition of ASTM A106B and ER70S-G Welding Wire
|
Material |
C (%) |
Mn (%) |
Si (%) |
S (%) |
P (%) |
Ni (%) |
Cr (%) |
Cu (%) |
Mo (%) |
V (%) |
Al (%) |
Ti (%) |
|
ASTM A106B |
0.21 |
0.42 |
0.28 |
0.010 |
0.020 |
0.012 |
0.023 |
<0.01 |
<0.01 |
0.0028 |
0.011 |
0.0017 |
|
ER70S-G Wire |
0.08 |
1.52 |
0.91 |
0.012 |
0.013 |
0.004 |
0.017 |
0.10 |
0.005 |
0.003 |
0.002 |
0.0035 |
Two welding processes, GTAW+SMAW and GTAW, were used, and no heat treatment was applied to the specimens before or after welding. The specimens were sequentially polished with silicon carbide sandpaper of grit sizes 240, 400, 600, 800, 1200, 1500, and 2000, followed by a final polish with a 2.5 μm diamond polishing compound. The polished specimens were etched with a 4% nitric acid-alcohol solution, and the microstructure of each welded joint region was examined using an OLYMPUS-GX51 optical microscope. The electrochemical specimens measured 8 mm × 8 mm × 2 mm for the parent material and heat-affected zone, and 5 mm × 8 mm × 2 mm for the weld zone. Before testing, the specimens were progressively ground with SiC water sandpaper up to 1000 grit, then cleaned with distilled water, degreased with alcohol, dried with compressed air, and stored in a drying oven for later use.
Potentiodynamic polarization curve measurements and galvanic current tests were conducted using a Gamry Interface 1000 electrochemical workstation. A three-electrode system was used, comprising an Ag/AgCl reference electrode, a platinum auxiliary electrode, and the parent material as the working electrode. The tests were performed at 25℃. The simulated fluid, based on a specific oil field, had the following composition: NaHCO₃ (0.337 g·L⁻¹), NaCl (28.234 g·L⁻¹), KCl (1.047 g·L⁻¹), MgCl₂·6H₂O (1.487 g·L⁻¹), CaSO₄·2H₂O (1.08 g·L⁻¹), CaCl₂·2H₂O (2.755 g·L⁻¹), and FeCl₂·4H₂O (0.125 g·L⁻¹). The self-corrosion potential of the weld seam, heat-affected zone, and parent material was initially measured for 70 minutes. The sample was then scanned from -500 mV to +500 mV relative to the open circuit potential at a scan rate of 0.167 mV/s to obtain the potentiodynamic polarization curve.
2. Results and Discussion
2.1 Microstructure
Figures 1 to 5 show the microstructures of the A106B steel parent material used in the pipeline, the GTAW+SMAW and GTAW weld seams, and their respective heat-affected zones. An analysis of the weld seam microstructures shows that the GTAW+SMAW has more granular ferrite and grain boundary ferrite, with a small amount of acicular ferrite and pearlite. In contrast, the GTAW weld seam lacks granular ferrite, has less grain boundary ferrite, more acicular ferrite, a small amount of pearlite, and finer grains. The microstructures of the heat-affected zones in both joints show that the GTAW+SMAW heat-affected zone closely resembles the weld structure. In the GTAW heat-affected zone, acicular ferrite increases significantly, and a substantial Widmanstätten structure is observed. The parent material exhibits a typical ferrite-pearlite microstructure.
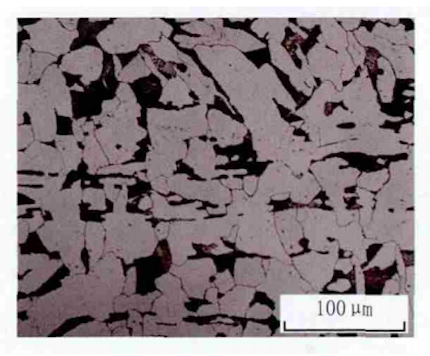
Figure 1 Microstructure of parent material
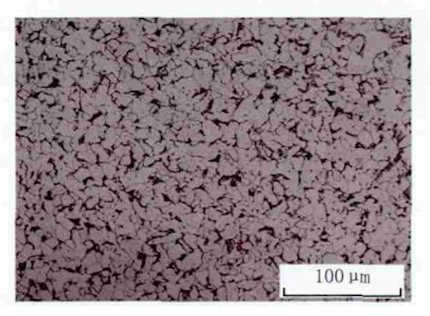
Figure 2 Microstructure of GTAW+SMAW weld seam
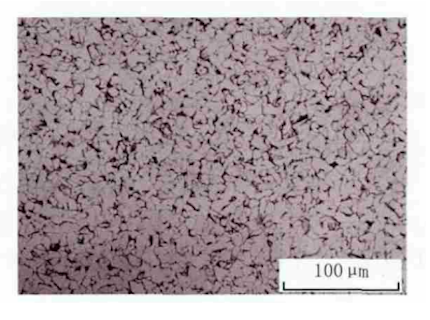
Figure 3 Microstructure of GTAW heat-affected zone
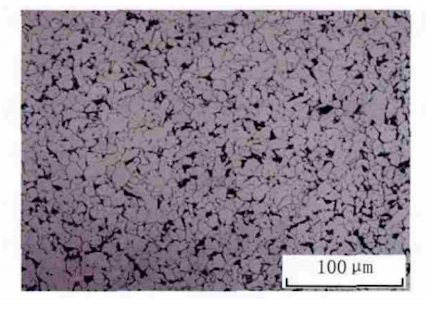
Figure 4 Microstructure of GTAW+SMAW heat-affected zone
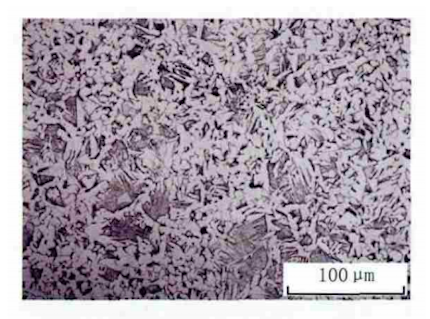
Figure 5 Microstructure of GTAW weld seam
2.2 Potentiodynamic Polarization Curve
Figure 6 presents the polarization curves of different regions of the welded joint under two welding processes in simulated oil field production fluid, while Table 2 provides the corresponding polarization curve parameters. Analysis indicates that the parent material has the lowest corrosion potential, the heat-affected zone has the highest, and the weld seam falls in between. This means the parent material exhibits the highest thermodynamic tendency for corrosion, while the heat-affected zone has the lowest.
Analysis of corrosion current reveals that the parent material of both welded joints has the lowest corrosion current, the weld has the highest, and the heat-affected zone falls in between. This indicates that the parent material exhibits the lowest corrosion kinetics and the slowest corrosion rate, while the weld demonstrates the highest corrosion kinetics and the fastest corrosion rate. In summary, the corrosion tendency follows the order: parent material > heat-affected zone > weld.
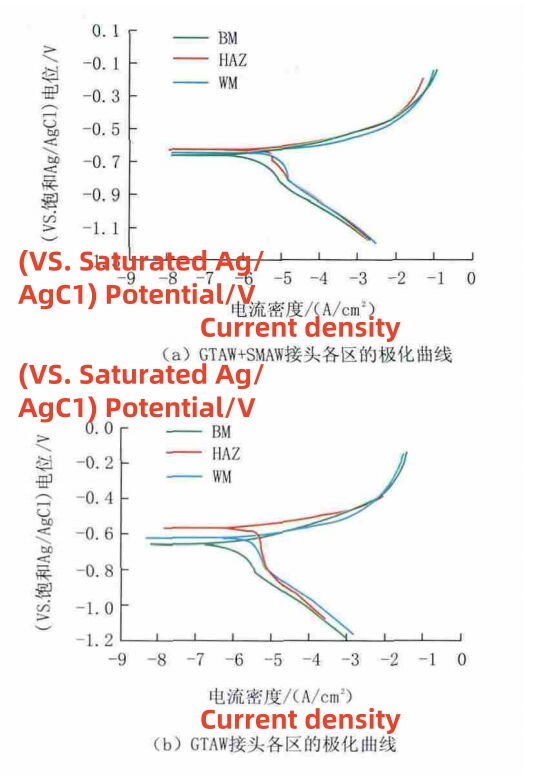
(a) Polarization curves of various regions of GTAW+SMAW joint (b) Polarization curves of various regions of GTAW joint
Figure 6 Polarization curves of various regions of welded joints
Table 2 Polarization curve parameters
|
Connector Type |
Detection Position |
icon (uA) |
Ecom (mV) |
B. (V/decade) |
Bc (V/decade) |
CR (mm/y) |
|
395 Connector
|
BM |
1.82 |
-658 |
0.051 |
0.228 |
0.033 |
|
HAZ |
6.31 |
-569 |
0.039 |
0.37 |
0.115 |
|
|
WM |
9.33 |
-636 |
0.048 |
2.65 |
0.169 |
|
|
226 Connector |
HAZ |
5.09 |
-626 |
0.051 |
0.43 |
0.092 |
|
WM |
9.48 |
-642 |
0.051 |
3.195 |
0.172 |
3. Conclusion
- The weld seam microstructures from both welding processes consist of ferrite and pearlite. In the GTAW-SMAW joint, the HAZ microstructure closely resembles that of the weld seam. In contrast, the GTAW joint’s HAZ microstructure differs significantly from the weld seam and contains a substantial Widmanstätten structure.
- In the simulated oilfield fluid, the thermodynamic corrosion tendency of the joint regions follows this order: HAZ < weld seam < parent material. Similarly, the corrosion rate increases in the order: parent material < HAZ < weld seam. The corrosion resistance of the joint regions follows the order: parent material > HAZ > weld seam.
Post URL: https://www.landeepipefitting.com/study-on-electrochemical-corrosion.html
Landee is a professional industrial pipe fitting manufacturer and be well accepted by customers all over the world, we has been producing Pipe Fitting for a variety of applications since 1985. welcome to access our website: https://www.landeepipefitting.com.
Next: Failure Analysis of Reducers in the High-Pressure Heater of a Nuclear Power Plant
